Enjoy an interactive web calculator with nice-looking graphs and charts
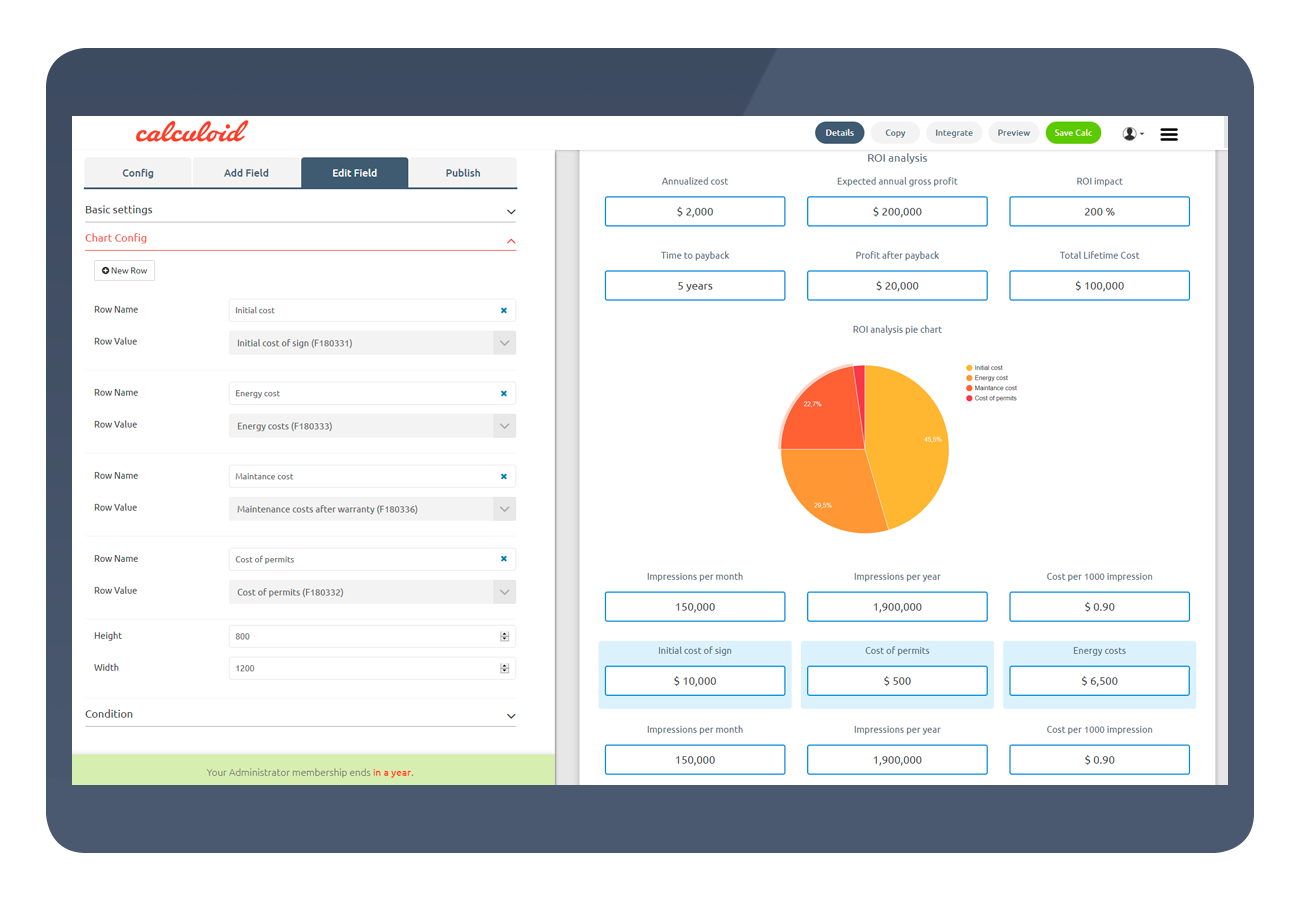
Use gauge graph to display a calculated value in tachometer look or pie chart to show multiple values into slices to illustrate numerical proportion.
Graphs and charts are great because they communicate information visually. No more need to read text, numbers and tables when presenting calculation results.
Graphs and charts form the core of interactive content in Calculoid.